This week, my Housing, Community, and Economic Development (HCED) course focuses on urban inequality of wealth and income. I recently wrapped up Thomas Piketty’s book Capital in the 21st Century, so I have been thinking about the role of wealth in social inequalities for the last few months. I’m excited to briefly survey Piketty and how his work connects with the racial wealth gap.
My HCED class readings included an overview of Piketty’s book (with six key charts!) and a much more dense academic article summarizing “The Top 1 Percent in International and Historical Perspective.” But the readings also dive into a topic not covered by Piketty’s charts: the racial wealth gap. The titles of the readings, which include “Black Wealth / White Wealth” and “Being Black, Living in the Red”, reveal a fairly straightforward answer to the source of racial inequality in the United States: an unequal distribution of wealth.
Piketty’s chart on income inequality in the United States provides a useful overview of US class dynamics over the last century. What is fascinating is the steep drop of inequality that happening in the 1940s during World War II. This new more-equitable distribution of American income continued until 1980, before shooting upward to levels greater than even the 1920s.
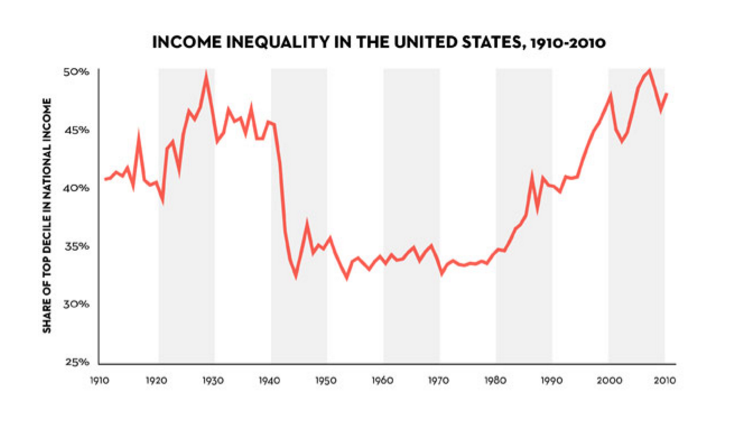 What isn’t obvious from this chart, but is covered in Piketty’s book, is that the decline of income concentration of the top 10% of Americans was redistributed to create a new Middle Class. This redistribution occurred for many reasons: the significant leverage of Labor Unions during World War II, the imposition of confiscatory tax rates of 90% for the highest US incomes, and social policies like the Federal Housing Authority and the GI bill which provided mortgages and housing to previously working class families. Taken together, this created a much more equitable society in terms of income from 1940 through 1980. The wistfulness for this era shows up in our politics when leaders warn of the decline of the middle class.
Piketty’s chart also misses a key factor: race. Federal policies that enabled the creation of the (white) middle class of the United States deliberately excluded blacks. Some of the specific harms include the redlining of investment in black neighborhoods neighborhoods, exclusion of blacks from mortgages, and overall ambivalence from the government toward white racial violence in the American South. These racist policies compounded the racial inequalities of wealth left over from slavery and Jim Crow segregation.
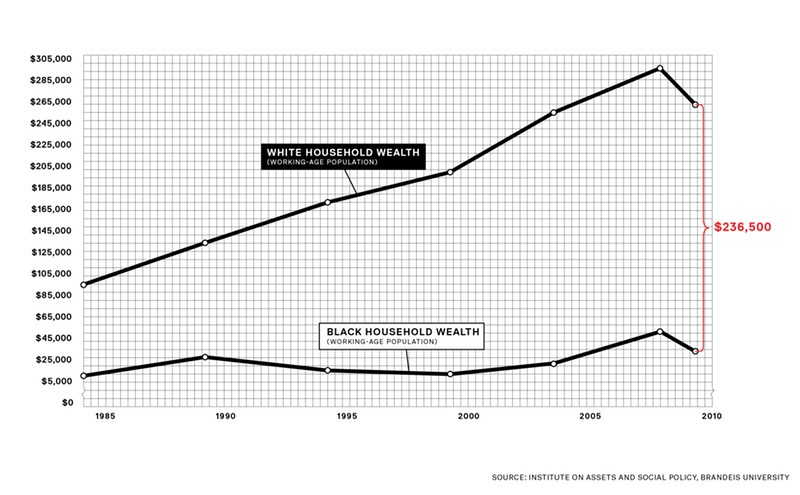
Even with these racists policies, data shows that blacks have largely caught up to whites in terms of wages. However, data on wealth tells a different story. The “Roots of the Widening Racial Wealth Gap” study from the Brandeis Institute on Assets and Social Policy graphs the evolution of the median net-worth for black families and white families from 1983 to 2010. According to the data, the gap between the wealth of a median black family and the wealth of the median white family was $85,000. By 2010, that gap had risen to $236,500.
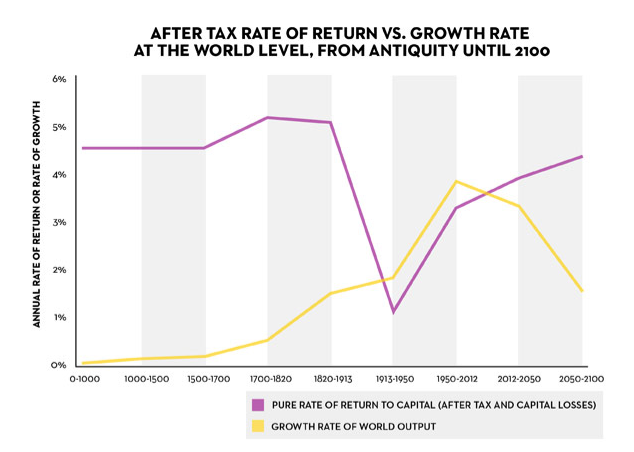
There are many complex reasons for why the wealth gap got worse for whites and blacks over the last 30 years. But one relatively simple reason is that wealth gains compound over time, especially during periods of slow economic growth. Piketty defines this as a scenario when “r is > g”, or when the average rate of return on capital is greater than the average rate of economic growth (which roughly equals the average rate of wage growth). According to Piketty, this has been the case for most of human history. The one, notable exception was the massive shock posed by World War II and the ensuing forty years of high economic growth and low capital returns. Piketty’s chart showing the rate of return (r) vs the growth rate (g) is below.
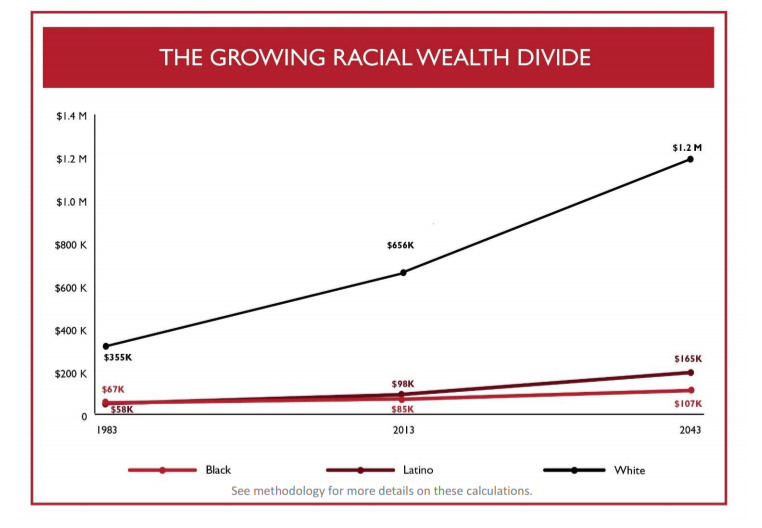
For racial income inequalities, the basic logics of r vs g is even greater because blacks tend to see less income growth due to economic growth than whites. So when you take compounded wealth effects for whites and lower overall wealth and income for blacks, you get concentrated wealth inequality by race. A new report called The Ever Growing Gap extrapolates this logic by extrapolating the past thirty years of growth rates for white and black wealth an additional thirty years into the future. The result is black wealth of only 9% of white wealth, with an average gap of over $1 million (the difference in starting values in 1983 from the Brandeis study is due to the use of the average wealth in this calculation, while the Brandeis study used median values).
Here’s the takeaway from all of this: a snowballing positive-feedback effect is widening the racial wealth gap. And without a dramatic policy intervention (ideally involving reparations), the wealth divide between blacks and whites will only get worse and worse.
No comments:
Post a Comment